vAPM Application Performance Monitoring
A solution for improving digital application performance.
vAPM thu thập, phân tích và xử lý dữ liệu telemetry để xây dựng dashboard, cảnh báo real-time và khả năng truy vết toàn trình cho web, mobile và Services số hiện đại.
Telemetry First
Distributed Tracing
Service Maps
Real-time Alerting
Overview
End-to-end observability, from telemetry data through to the end-user experience.
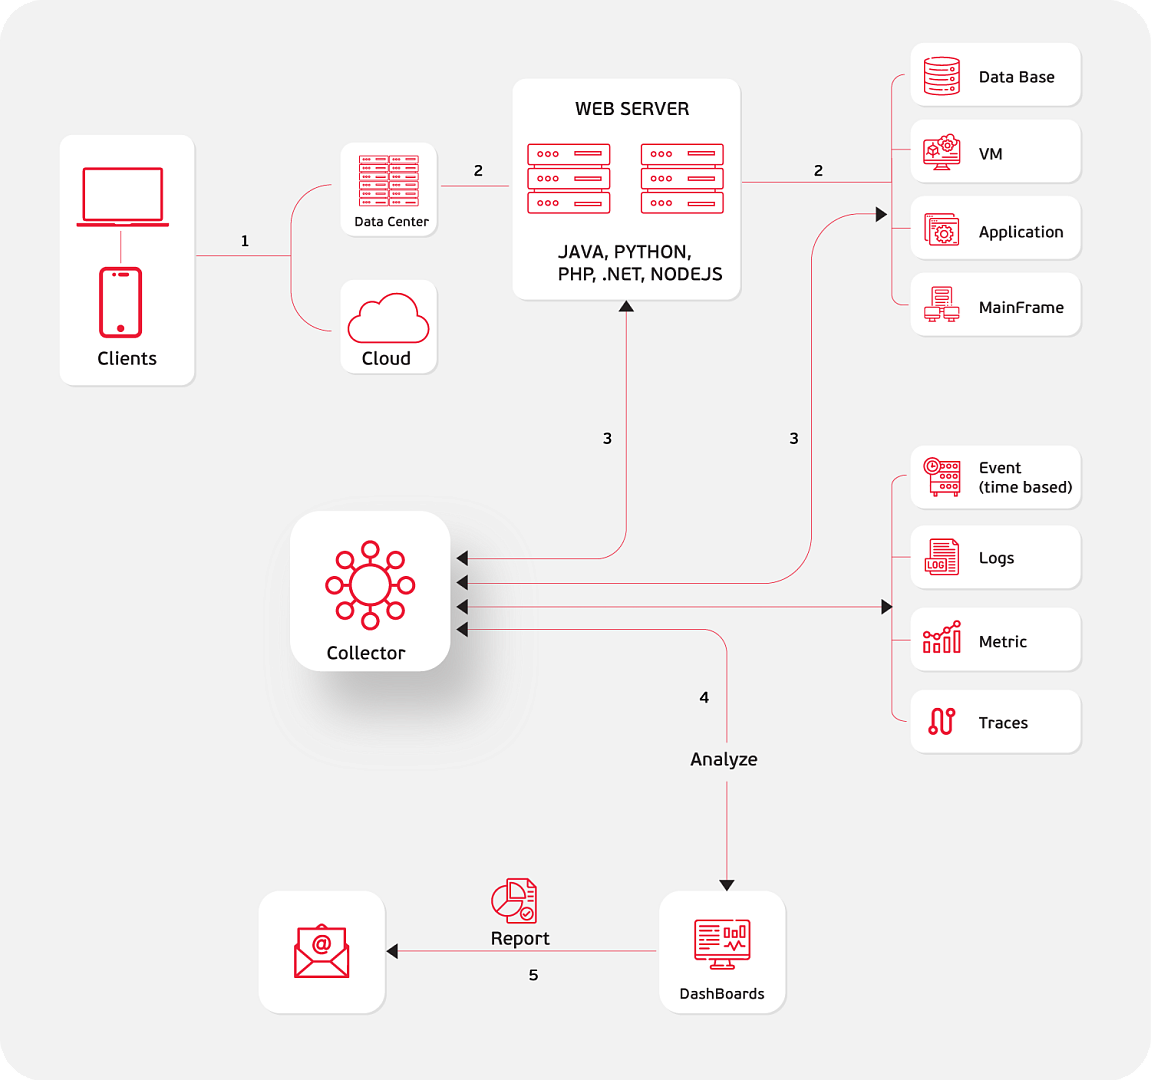
vAPM lets a business observe application performance in real time from telemetry data, and build dashboards, alerts and incident traces on a single unified view.
The solution suits web and mobile applications, APIs, internal services and cloud-native systems running in increasingly complex environments.
Rather than passive monitoring, vAPM creates an active observability layer so that operations teams can identify root causes, reduce MTTD and MTTR, and improve the end-user experience.
Key features
Comprehensive monitoring, fast incident detection and proactive system tuning.
vAPM combines technical and experience data into a single observability layer for development and operations teams.
Comprehensive application monitoring
Consolidates system data onto a single platform, supports collection from open source environments, and combines the full set of components needed for 24/7 operations.
- A central dashboard so development, operations and management teams read the same data.
- Integrates telemetry from metrics, logs, events and traces to standardize analysis.
- Easy to extend to a multi-tenant model when a business has several applications or units to monitor.

Detect incidents quickly
Distributed tracing, log-to-trace correlation, and code-level drill-down reveal bottlenecks before they affect users.
- Analyze distributed traces to pinpoint bottlenecks across the service chain.
- Trace critical transactions quickly by combining the service map with alerting.
- Shorter MTTD and MTTR through complete data and diagnosis in context.

Proactively optimize the system
Monitoring SLAs and business KPIs and surfacing application errors in real time lets engineering teams intervene sooner.
- Uses AI/ML to consolidate errors and alerts without relying on manual processes.
- Visualize operations in a single dashboard to streamline incident handling.
- Sync telemetry to development environments to support analysis and continuous improvement.

Improve the end-user experience
Browser monitor, synthetic monitor and mobile monitor give a direct view of user behavior and service quality.
- Measure metrics such as LCP, FID and CLS to optimize load speed and layout stability.
- Simulate user behavior to test availability, SSL, broken links and user flows.
- Monitor mobile apps down to code level for clear visibility of network, stack traces and HTTP errors.
Compare
Traditional monitoring and vAPM differ in approach.
vAPM moves from fragmented observation to proactive diagnosis, centralizing data and answering deeper questions about each incident.
Traditional monitoring
vAPM
Passive, reactive after incidents
Proactive — detects issues before they spread
Context-dependent, fragmented data
Predictable, centralized data
Answers: what + when
Answers: what + when + why + how
Diagnostic sampling
Use all telemetry data
Fragmented observability across tools
Unified service maps and tracing
Hard to connect business and technical teams
Tracks SLAs, KPIs and user experience
Technology & data
Multi-language support, complete telemetry and flexible integration.
The solution fits modern application architectures: web services, mobile app back ends, containers and cloud-native systems that require close control.
Go
Java
.NET Core
.NET Framework
Node.js
PHP
Python
Ruby
Kubernetes
Containers
API
AIOps
Lightweight agent
The vAPM agent typically uses only a small share of system resources and suits a wide range of application environments.
Full telemetry
Collects metrics, logs, events and traces to support analysis in context.
Extended integrations
Connect easily to your existing open-source stack while extending to APIs, dashboards and workflows.
Experience monitoring
Combine browser, synthetic and mobile monitors to see the full user journey end to end.
Benefits
Lower cost, greater control and more efficient operations.
From system reliability to user experience, vAPM delivers clear benefits for organizations running digital applications at scale.

Build trust
Operations teams gain confidence when every application state is tracked and alerted on centrally.

Improve application performance
Identifying the true root cause saves engineering time and lets the team focus on improving features.

Central management
Manage applications, users, alerts, and resources from a single unified interface.

Cost savings
Lower cost in people, tooling and time than building your own monitoring team from scratch.
Comprehensive monitoring
24/7 application monitoring with a clear view of service maps and critical transaction chains.
Detect incidents quickly
Drill down to code level to shorten MTTD and MTTR and reduce the impact on end users.
Better experience
Browser, synthetic and mobile monitoring give clear data for a better digital experience.
Use cases
Suited to a wide range of business models and application systems.
vAPM is built for organizations that need end-to-end visibility into request handling, incidents and user experience across multiple infrastructure layers.
Businesses with mission-critical applications
Suited to systems that generate core revenue or have strict requirements for availability, performance and continuous monitoring.
- Track SLA and business KPIs
- Real-time incident alerts
- Less service disruption
Cloud-native businesses
Supports modern application environments built on containers, Kubernetes and increasingly complex distributed architectures.
- Observe distributed service chains
- Monitor transactions and the service map
- Detect bottlenecks before they spread
Software development team
For software, outsourcing, gaming and digital application companies that need end-to-end monitoring.
- Error analysis down to the code level
- Supports optimizing the development lifecycle
- Shorten incident response time
Web and mobile services
Monitor the performance of web services and mobile app services to maintain load speed, stability and user experience.
- Browser monitor
- Synthetic monitor
- Mobile monitoring
Why choose vAPM?
A platform for managing application performance with a proactive approach.
vAPM brings together modern observability technology, clear operating procedures and flexible integration so your business can focus on growth.
End-to-end observability, from the infrastructure layer to the end-user experience.
Suited to both legacy applications and modern cloud-native architectures.
Helps development, operations and management teams decide faster.
Flexible deployment based on your application model, monitoring scope and integration requirements.
FAQ
What to know before deploying vAPM.
If needed, the team can assess your current application architecture and propose a suitable monitoring scope, alerting setup and integration model.
What is vAPM?
vAPM is an Application Performance Monitoring solution that helps businesses collect, analyze and process telemetry for end-to-end application performance monitoring.
Which data types does the solution support?
vAPM works with metrics, logs, events and traces, and combines dashboards, real-time alerting and a service map for system observability.
Does vAPM add much overhead to the system?
The agent is designed for a small resource footprint, which varies with the application, environment and specific deployment configuration.
Are multiple application languages supported?
Yes. The solution supports common languages including Go, Java, .NET, Node.js, PHP, Python and Ruby.
What business models does this solution suit?
vAPM suits websites, mobile applications, API systems, cloud-native services, and any environment that needs proactive monitoring.
What does a business need to prepare before deployment?
It usually requires a review of the application architecture, monitoring scope, alerting requirements, permissions, and existing integrations.
vAPM Application Performance Monitoring
Contact us for a consultation
Ready to improve your digital application performance?
Contact us for advice on the vAPM model that fits your current systems, your monitoring scope and your user-experience optimization goals.